
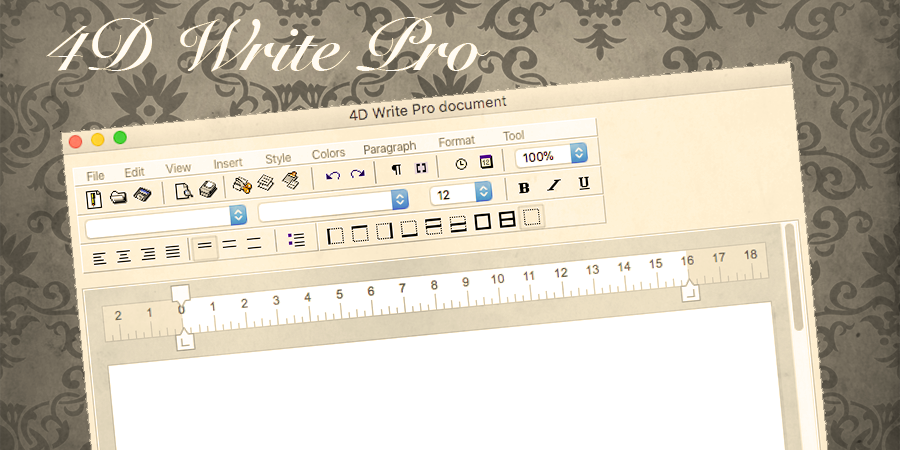
4D Write-like toolbar example for 4D Write Pro
Moving to 4D Write Pro is a great evolution to make your applications ready for the latest (and future) operating systems. However, new tools can sometimes be intimidating. Do you miss the vintage 4D Write plugin’s toolbar? No problem, here’s a 4D Write Pro toolbar example that looks just like it!
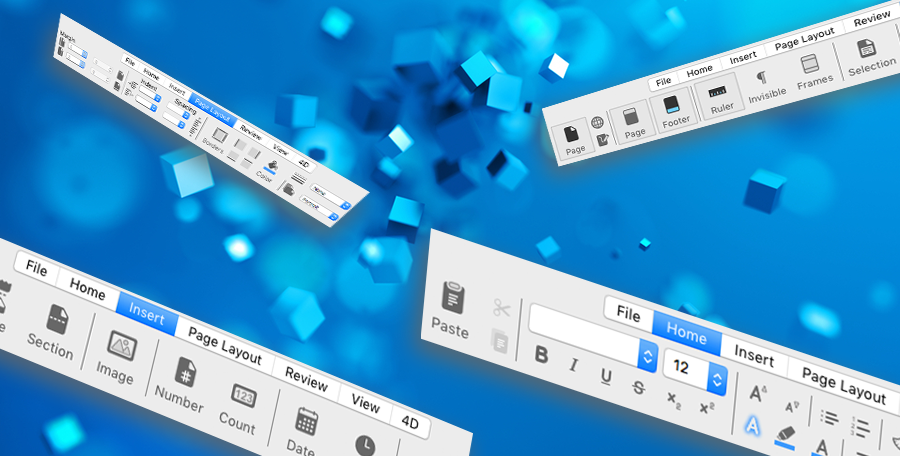
Ready-to-use toolbar example for 4D Write Pro
You’d like to use 4D Write Pro, but don’t have the time to create a toolbar from scratch? We’ve created a sample application with a ready-to-use toolbar, including two icon families, so you can choose the toolbar style you prefer (flat design or classic). And on top of that, we also added a complete menu bar! Check it out and reuse it for your own applications!

Rearrange the object entry order in a single click
When working on a form, it often happens, for a reason or another, that you insert new objects within a group of existing objects in your form. In that scenario, the resulting object entry order often becomes illogical, and would let the user enter information in an awkward manner. This is where you need to restore the entry order to a logic one, and it can be a tedious task…

Use DIALOG instead of MODIFY SELECTION
There is an old saying: “Old is gold” meaning that new ways are not as good as the old ones. But the new way to say is “Old is gold but new is platinum“. We are not referring to jewelry here but two of 4D commands: MODIFY SELECTION and DIALOG.
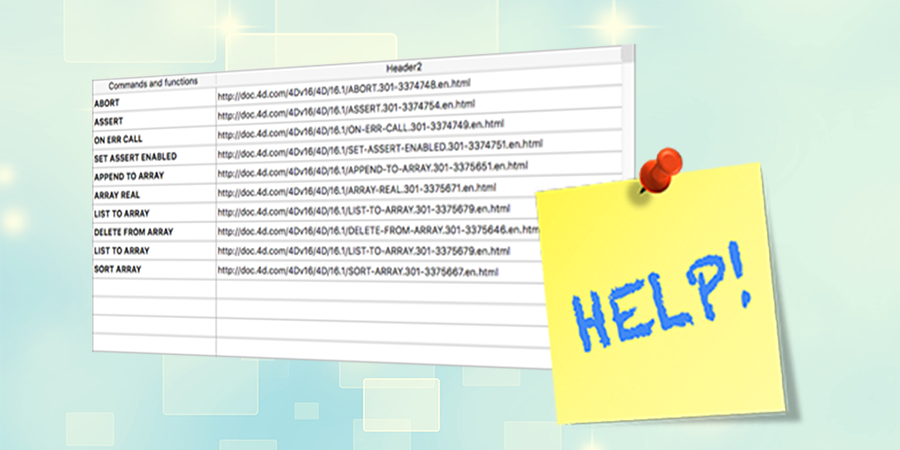
Help tips on list boxes!
Help tips or hints are very useful, as they simplify the user interface and help users understand objects that sometimes aren’t self-evident. 4D supports help tips in most areas and inputs when hovering the pointer over them, but that was not the case with a list box object.
With 4D v16 R5 we have added the possibility to display a help tip on a list box cell thanks to the enrichment of two commands.
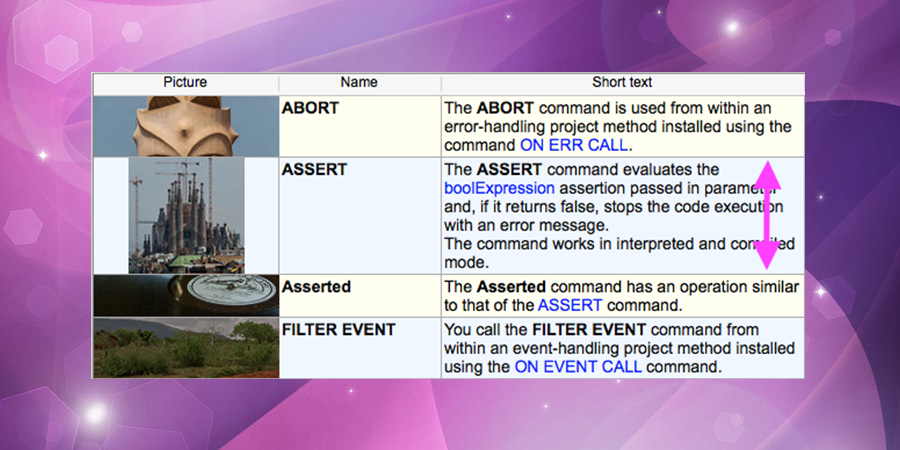
Automatic row height in list boxes, a new 4D View Pro feature!
Starting with 4D v16, you can set a different row height for each row in your list box. So with a few lines of code, you have a list box with rows that conform to the content. With this 4D v16 feature, we gave full control to the developer to precisely define the height for every single row of the list box.
With 4D v16 R5, we’ve decided to go further, and provide you with a fully automatic mode. It’s now possible to display lists in a gorgeous interface without any programming. You only need to set a few properties in the list box, and 4D does the rest for you. It’s magical, fluid, and again … not a single line of code!
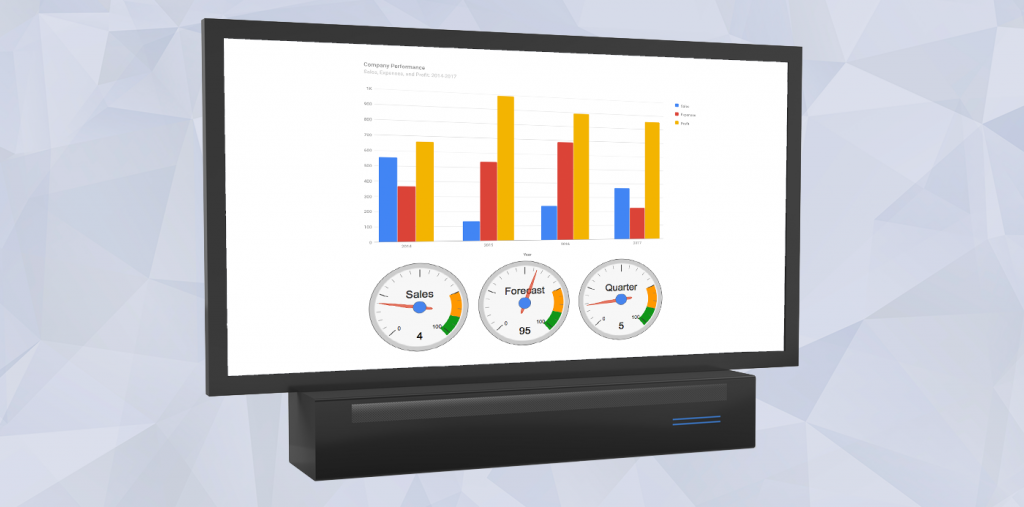
Display your dashboard on a big TV screen
Today, big screens are everywhere. At the airport or train station for arrival/departure. In production areas for failure/success or production numbers. In call centers for activity or calls in queue. In stock exchange for a ticker.
Your first thought could be to use a normal computer, macOS or Windows, with a “27” or 30” screen. Expensive, but easy to do. But besides the high price, you need to run a 4D app, launch it, update it, all just to display a picture?

How to use Google Charts with 4D
According to neuroscientists, we respond better and faster to a visual form than any other type of representation. That’s why graphs and charts are clearly a key to a better understanding of data.
So if you’re looking to display bar charts, histograms, or pie charts which are modern and fully compatible with the leading browsers, but also more suitable for the way the human brain processes information, Google Charts is one possible answer. The available chart types in Google Charts is varied: from the classical bar/column/pie charts, Google Charts also offers elaborated graphs such as Treemap, Candlestick and Gauge charts.

4D introduces SDI mode for applications on Windows!
Hot news! 4D applications on Windows are entering a new world thanks to 4D Windows 64-bit. Do you remember the grey-background main window which contains all other application windows? This main window is technically called MDI (which stands for Multiple Document Interface) and now there’s a way to get rid of it and move to SDI (Single Document Interface) where application windows are all independent…
Interested? Just activate the SDI mode with a single checkbox and it’s done…without a line of code!

Merge your windows into tabs on macOS Sierra
Thanks to macOS Sierra, applications now have to opportunity to use tabbed windows instead of multiple windows. From 4D v16 R3, 4D Developer Edition 64-bit can take advantage of this Apple’s new feature for the design environment.
The type of windows that can be tabbed are Methods and Form Editors windows. Other windows as explorer or tools for instance remain separate.
As in every application based on tab windows:
- each tab can be moved to a new window by dragging the tab out of the tab bar.
- each tab can be moved to another existing window.
Contact us
Got a question, suggestion or just want to get in touch with the 4D bloggers? Drop us a line!
* Your privacy is very important to us. Please click here to view our Policy