4D Blog

Home Tips How to use Google Charts with 4D

How to use Google Charts with 4D

August 9, 2017

Tips 3D chart on Tablet

According to neuroscientists, we respond better and faster to a visual form than any other type of representation. That’s why graphs and charts are clearly a key to a better understanding of data.

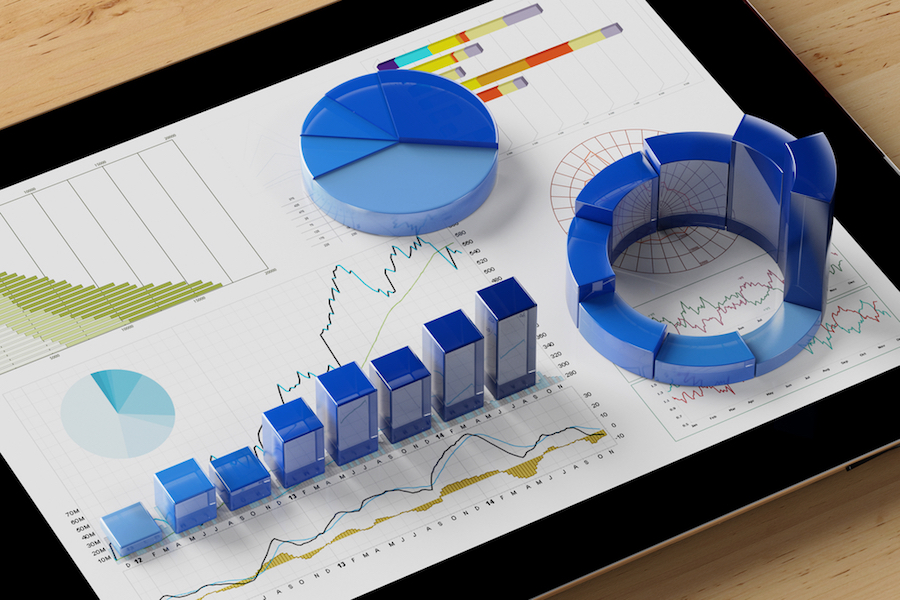
So if you’re looking to display bar charts, histograms, or pie charts which are modern and fully compatible with the leading browsers, but also more suitable for the way the human brain processes information, Google Charts is one possible answer. The available chart types in Google Charts is varied: from the classical bar/column/pie charts, Google Charts also offers elaborated graphs such as Treemap, Candlestick and Gauge charts.

This blog posts provides an example of a donut, map and bar chart. Each chart displays the population by country in South America. In the following database, you have the 4D method to retrieve the data as well as several HTML files to display the different charts.

Database example

Data format

This database is very simple. A single method, GetJsonData, is needed to return a JSON data array meeting the Google Chart specification.

In the three following chart examples, the data format is the same, as shown below:

{
   "Data":[
      ["Country", "Population"],
      ["Argentina", 43847277],
      ["Bolivia", 10888402],
      ["Brazil", 209567920],
      ["Chile", 18131850],
      ["Colombia", 48654392],
      ["Ecuador", 16385450],
      ["Gabon", 1763142],
      ["Guyana", 77061],
      ["Paraguay", 6725430],
      ["Peru", 31774225],
      ["Suriname", 54761],
      ["Uruguay", 3444071],
      ["Venezuela", 31518855]
   ]
}

Donut chart

You can find the donut chart example in the “donutChart.html” file in the WebFolder.

An example of donut chart with Google Chart

Please refer to the Pie chart documentation from Google Charts for more information.

Map chart

You can find the map chart example in the “geoChart.html” file in the WebFolder.

An example of Geo chart with google chart

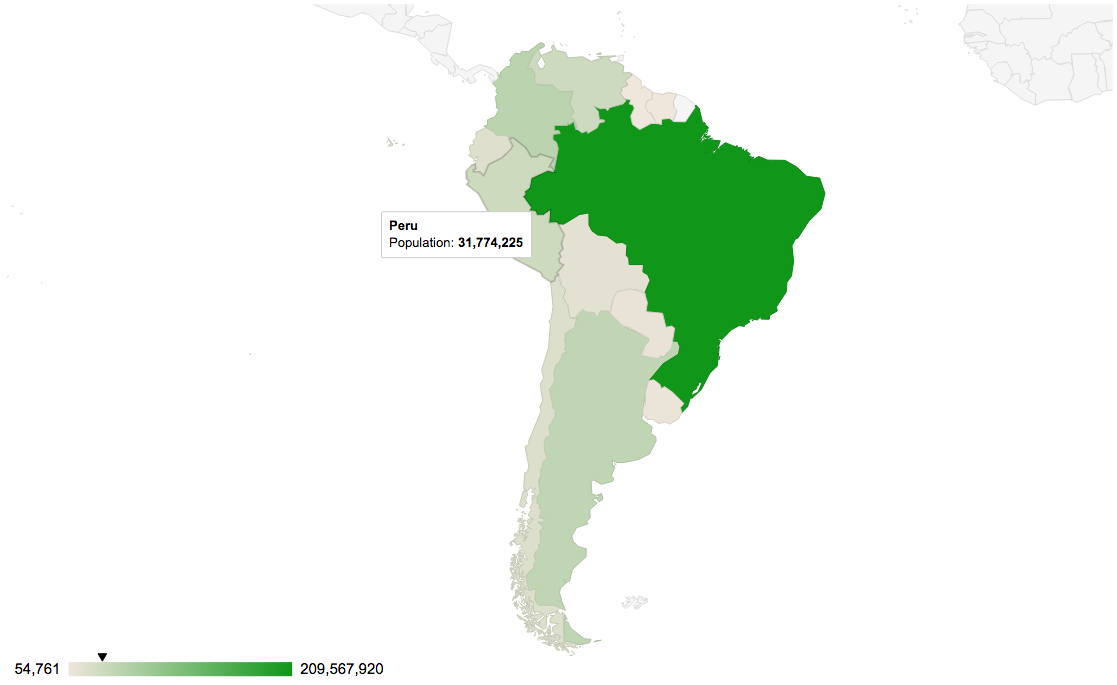
For more details, please refer to the Geo chart documentation from Google Charts.

Bar chart

You can find the example of a bar chart in the “barChart.html” file in the WebFolder.

An example of bar chart with Google Chart

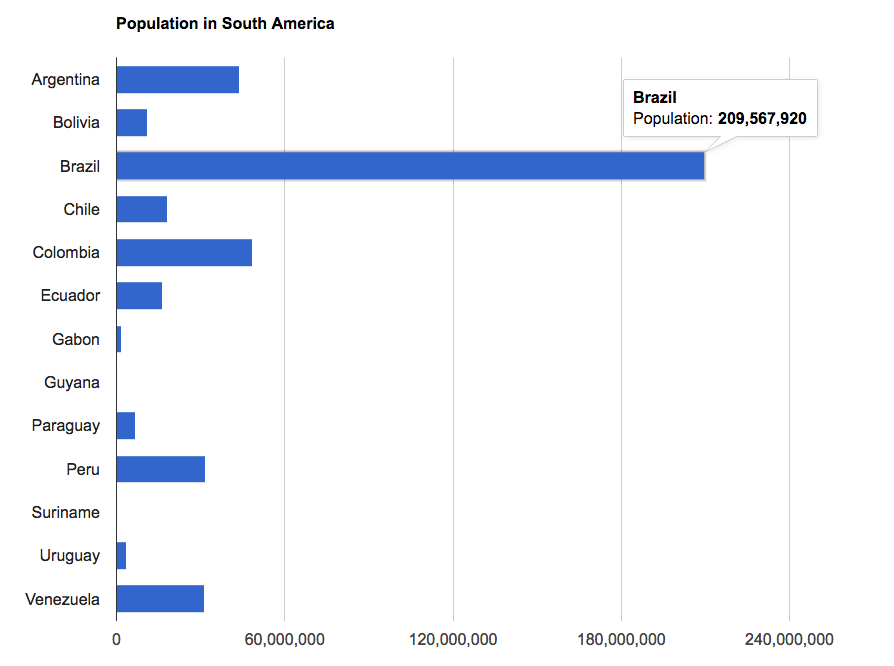
For more details, please refer to the Bar chart documentation from Google Charts.

Discuss

Tags Graph, UI, User Experience, Web

Latest related posts

  • April 9, 2025

    Restrict data according to privileges or information saved in session storage

  • April 7, 2025

    Designing an Interactive and Dynamic Menu Bar in Qodly application

  • April 3, 2025

    Customize your Qodly interfaces with CSS

Vanessa Talbot
Vanessa Talbot
• Product Owner •Vanessa Talbot joined 4D Program team in June, 2014. As a Product Owner, she is in charge of writing the user stories then translating it to functional specifications. Her role is also to make sure that the feature implementation delivered is meeting the customer need.Since her arrival, she has worked to define key features in 4D. She has worked on most of preemptive multi-threading new features and also on a very complex subject: the new architecture for engined application. Vanessa has a degree from Telecom Saint-Etienne. She began her career at the Criminal Research Institute as a developer for the audiovisual department. She has also worked in media and medical fields as expert in technical support, production as well as documenting new features.
  • Deutsch
  • Français
  • English
  • Português
  • Čeština
  • Español
  • Italiano
  • 日本語

Categories

Browse categories

  • 4D View Pro
  • 4D Write Pro
  • 4D for Mobile
  • Email
  • Development Mode
  • 4D Language
  • ORDA
  • User Interface / GUI
  • Qodly Studio
  • Server
  • Maintenance
  • Deployment
  • 4D Tutorials
  • Generic
  • 4D Summit sessions and other online videos

Tags

4D-Analyzer 4D for Android 4D for iOS 4D NetKit 4D Qodly Pro 4D View Pro 4D Write Pro 20 R8 20 R9 Administration Authentication Build application CI/CD Class Client/Server Code editor Collections Compatibility settings Formula Listbox Logs Mail Microsoft 365 Network Objects ORDA PDF Pictures Preemptive Programming Qodly Studio REST Scalability Security Session Source control Speed Spreadsheet Tutorial UI User Experience v20 vscode Web Word processor
Subscribe to 4D Newsletter

© 2025 4D SAS - All rights reserved
Terms & Conditions | Legal Notices | Data Policy | Cookie Policy | Contact us | Write for us


Subscribe to 4D Newsletter

* Your privacy is very important to us. Please click here to view our Policy

Contact us

Got a question, suggestion or just want to get in touch with the 4D bloggers? Drop us a line!

* Your privacy is very important to us. Please click here to view our Policy