We recently reviewed the formats of our logs to increase their readability and their compliance with automated analysis. We made these improvements in response to real-life situations we experienced, directly addressing issues that were hindering our ability to use 4D logs. In this blog post, we’ll explain in detail what changes we made so you can adjust your log analyzing tools accordingly.
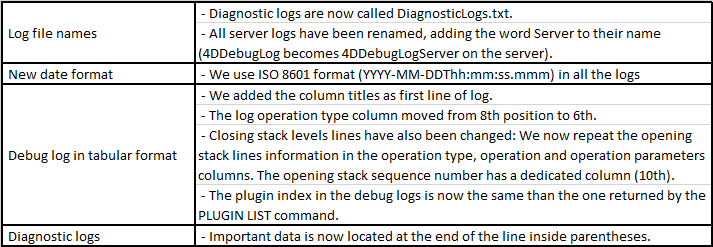
The description of the 4D log format can be found here, and the list of changes compared to 4D v18 is explained in this tab:

Our date format is now the same across all of our logs. Making connections between different logs is now easier.
We’ve renamed our log files. As we often compare server logs to client logs, having different names for both files is very practical to avoid confusing one with the other.
We’ve reorganized the debug logs in tabular format. They’re now easier to read for human beings. We also use the same values for the plugin index and the result of the PLUGIN LIST command.
Diagnostic logs are human-readable, and that’s something we wanted to keep, but we’ve also improved their format for automated treatment.
Also, the Debug Log Analyzer has been converted to v19. You’ll find the new version here. And if you don’t know about this wonderful tool, we encourage you to read this blog post.
Logs are important for your work as well as for ours. The 4D support team uses them frequently to help you fix unexpected issues, so don’t forget about them when you experience a problem, they’re a true gold mine.
Of course, if you have any questions about these changes, feel free to ask on the 4D Forum!


Comments are not currently available for this post.