
A new tool at your fingertips to analyze debug logs
July 31, 2019
5 min read

With 4D v17 R5, we’ve improved the debug logs by adding methods and allowing each process to be traced independently. With this R-release, we’ve gone a step further by shipping a debug logs analyzer tool to help you monitor process execution. You’ll be able to see which processes are the most consuming, the call chain with the corresponding running time, and much more.
In this blog post, we’ll look at a scenario where we have to find out why there’s slow responses from a database serving dynamic web pages.
Some users have noticed that the website is sometimes slow, but can’t provide more details. There are several ways to investigate, so let’s take a look and try to figure out what’s going on!
The debug logs analyzer is based on the 4D v14 debug logs file format. So to activate logging, just use the following code:
//debug logging activated with parameters (option 2), 4D v14 file format (option 4), and postponed writing (option 8)

SET DATABASE PARAMETER (Debug log recording;2+4+8)
Keep in mind that starting with 4D v17 R5, you can enable debugging for a single process. If you suspect a particular process to be responsible for the latency, it’s now easy and less time-consuming to start debugging logs just for that particular process:
SET DATABASE PARAMETER (Current process debug log recording;2+4+8)
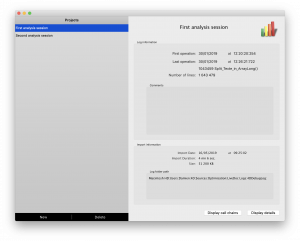
The debug logs analyzer manages projects, which are a set of debug logs files, and a debug log session.
When you open a database, a list of stored projects is shown. You can create a project using the “New” button. You need to choose the folder containing the debug logs or choose the files you want to analyze, then give your project a name.
Keep in mind that even if the analyzing process is running preemptively, it may take time depending on the number of files to scan and the processors in your machine.
By selecting the project from the list, a summary displays basic information such as the range of the debug logs and the analyzed lines. You can view the project’s call chains, statistics, and project details by clicking on the corresponding buttons.
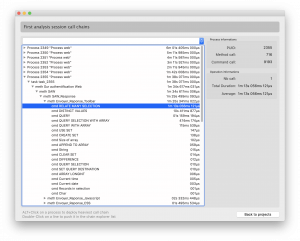
The call chain screen shows the list of processes with the total execution time. The list is ordered to display the most time-consuming processes at the top of the screen.
You can extend the process call chain and see the most consuming operation at each level. By clicking on a process with the ALT keystroke, it automatically extends the heaviest call chain, and by double-clicking on an operation, it moves it into the chain explorer. You can then select a level from the list to refresh the hierarchical list view at the corresponding level. For each command selected, the total number calls, the total duration, and the average duration are displayed.
In the example below, we searched for the most consuming processes and commands. We can see that the RELATE MANY SELECTION command can take over a minute to complete, so let’s take a look at the detailed information section and see where the command was called.
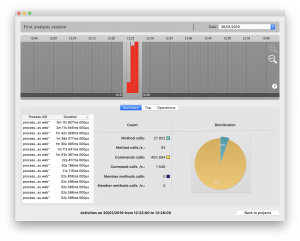
The detailed screen presents a timeline of the activity, displayed minute by minute. You can zoom in or out to see more or fewer details. This allows you to select the specific time range to analyze. You can select just one or several minutes by moving the limits.
When a new range is selected, an analysis is run and the results displayed at the bottom of the screen. By pointing out high activity periods, you have another way to determine slow processes .
The Summary tab shows the general statistics of the process execution time for the selected time interval. You can collapse the statistics by selecting a process from the list.
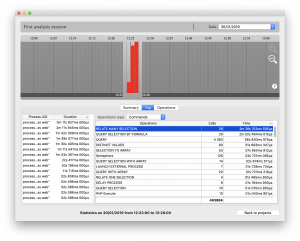
The Top tab displays all of the operations logged with their number of calls and total running time for the chosen processes and time range. The list can be reduced using a filter for commands, methods, or member methods. This is another good way to determine the most consuming commands, methods, etc.
Following our example, we’ve selected a time range and filtered by commands. A confirmation appears: the RELATE MANY SELECTION command is used a few times and took a long time. Let’s go to the next step for more details.
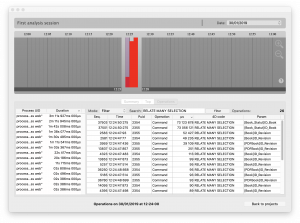
The Operations tab displays all of the detailed operations for a single, isolated minute for the chosen processes. You can reduce the list or simply highlight it by searching for an operation. This statistic is limited to one minute for performance reasons, so don’t forget to select the minute you want to see the initiated operations!
This list can be very useful because it shows you all of the lines of code executed. You can also order it by the column.
To finish our example, we searched for the RELATE MANY SELECTION command, filtered the list, and sorted by the Duration column (to put the longest calls at the top of the list). It seems that the two most time-consuming calls are made with the same field. A quick look at the structure of our database and we found the culprit: the field needed to be indexed.
This tool is designed to help you find conflicts in your code and improve the performance of your database. Get your hands dirty and have fun investigating by downloading the HDI above!
Got a question, suggestion or just want to get in touch with the 4D bloggers? Drop us a line!
* Your privacy is very important to us. Please click here to view our Policy
Comments are not currently available for this post.