
Tableau and 4D: Deploy your WDC to Github Pages
September 23, 2020
4 min read

In the How to connect Tableau with 4D blog post, you learned how to create a web data connector (WDC) to request data from 4D and visualize it in Tableau Public.
Now it’s time to host our WDC! Since it only uses HTML and JavaScript files, Github Pages is the best option to store them. This allows others to test your connector directly in their Tableau software. In this blog post, I’ll show you how to proceed.
Bonus: I’ll also show you how to debug your WDC in Tableau Public using Chrome. Let’s get started!
Before we start, be sure that you’ve already read the previous blog post. Let’s pick it up from the end.
Note: I’m assuming you’re familiar with GitHub and you can clone, commit, pull, and push with ease! If not, don’t worry, we have a series of blog posts to help you get started.
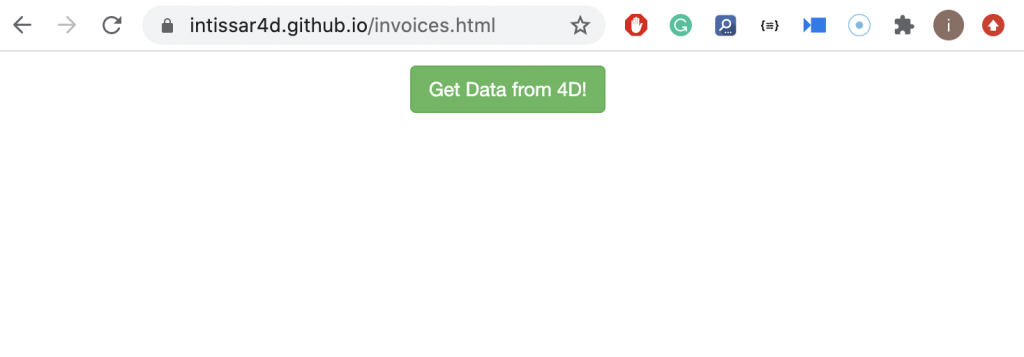
Now that your WDC is online, open a connection to it in Tableau Public.
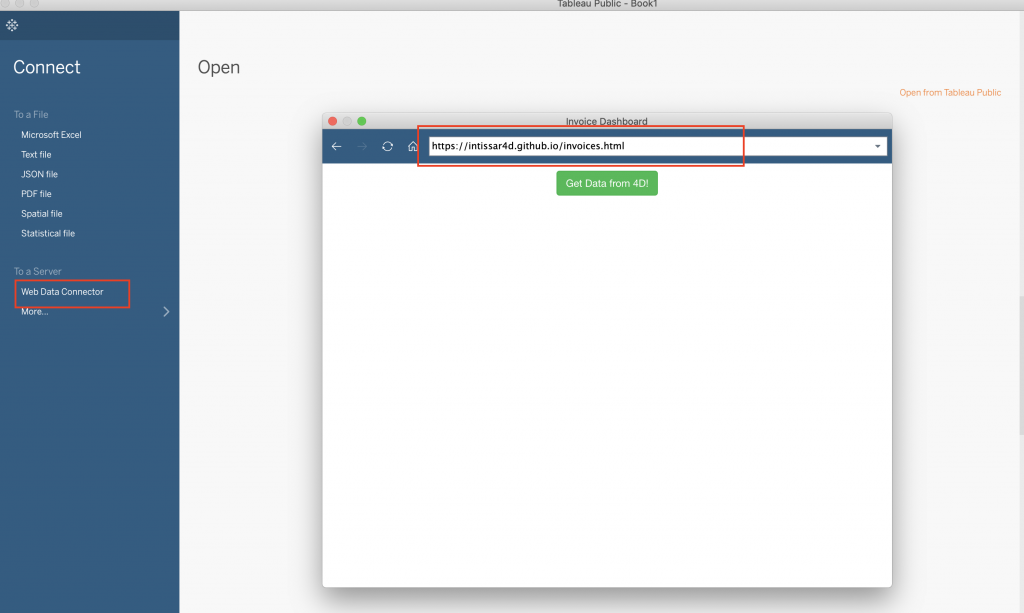
In the WDC dialog box, enter the URL of the WDC (https://username.github.io/invoices.html) as shown in the image below:
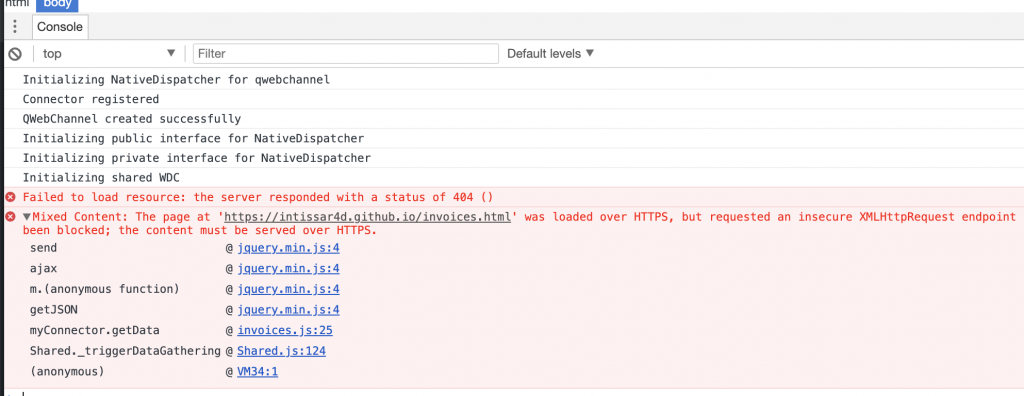
Our GitHub page is loaded over HTTPS, but our API is served over HTTP … which will lead to a mixed content error:
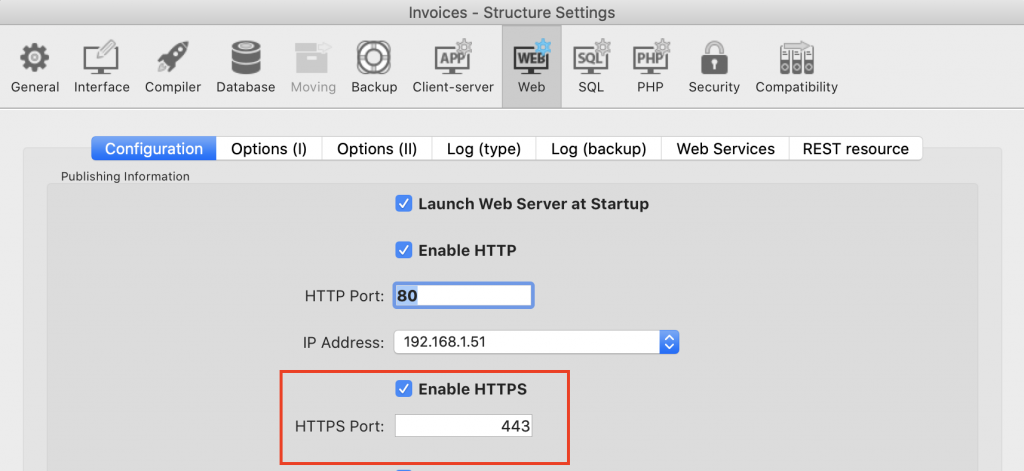
The solution is using 4D via HTTPS. To do so, you need to use the 443 port while checking the Enable HTTPS box (as shown in the image below), have a valid certificate installed, and expose your API so it can be accessed via the internet.
For the sake of this blog post, I used a self-signed certificate. You can watch this video from the 4D Summit 2020 for a better understanding of managing certificates.
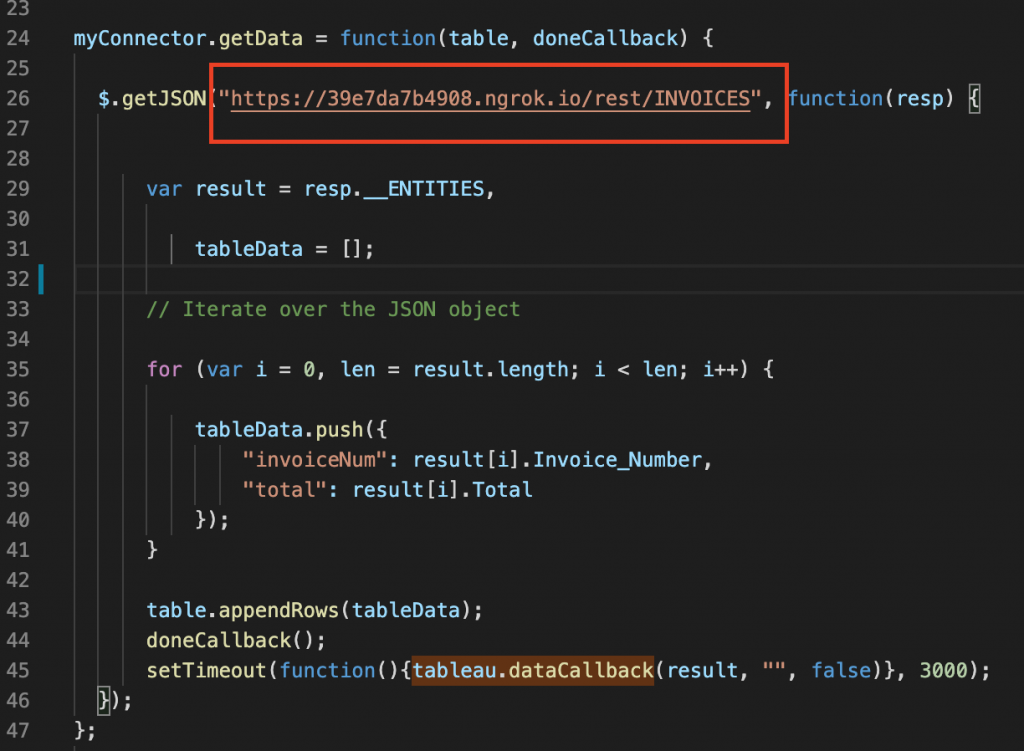
Also, as I said before, you’ll need to expose your locally running REST application to the internet, which means you’ll need a public IP address that can be accessed from anywhere on the internet (and not the one mentioned in the invoice.js file, which is a private one that can only be accessed within a Local Area Network (LAN)).
To get the public IP (and for demonstration purposes), I used a tunneling tool called ngrok that makes my locally-hosted web server appear to be hosted on a subdomain of ngrok.com:
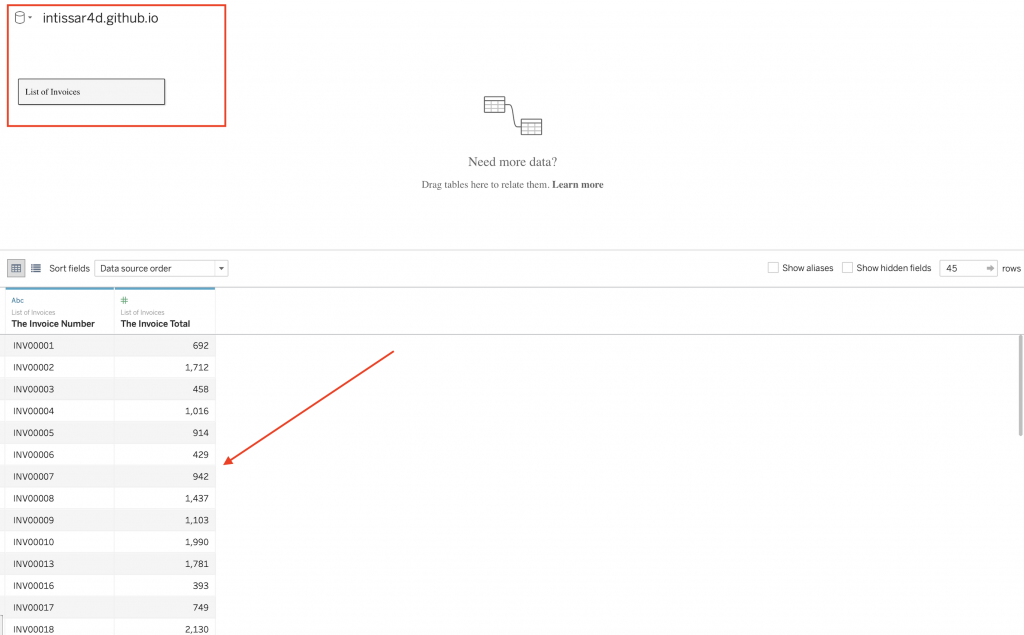
Once the certificate is ready and placed at the root of your project, HTTPS is enabled, and you’re armed with a public IP address, enter your GitHub Pages URL in Tableau Public.
This brings up the table which can now be used for visualizations:
Congratulations! Your WDC is successfully deployed, accessed, and you’re ready to visualize your 4D data!
Sometimes when you create a WDC, it can work with no problems in the simulator (http://127.0.0.1:8888/Simulator/index.html) but isn’t able to load data in Tableau Public. When you hit the Update Now button, the loading screen is displayed, but data never shows up:
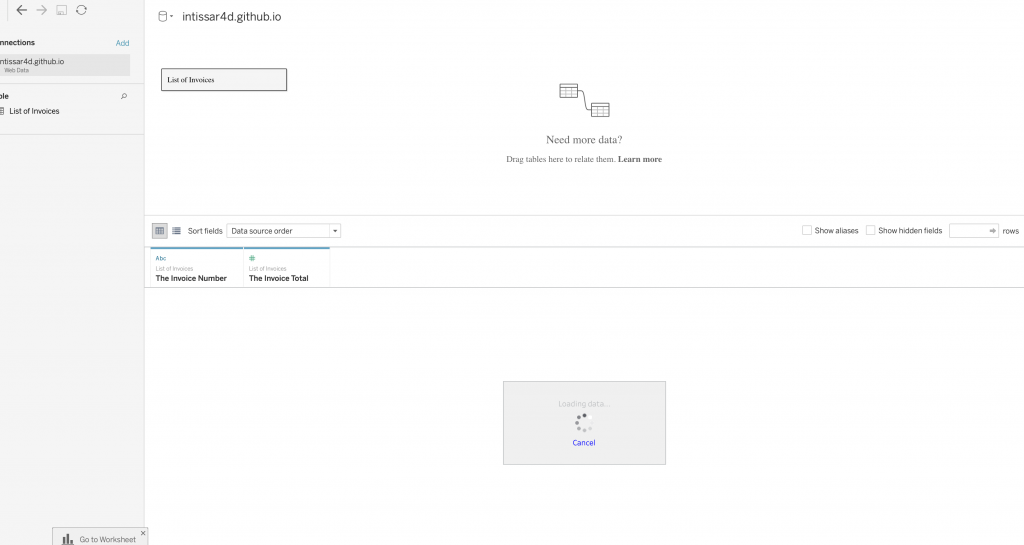
What to do? How to know exactly what went wrong?
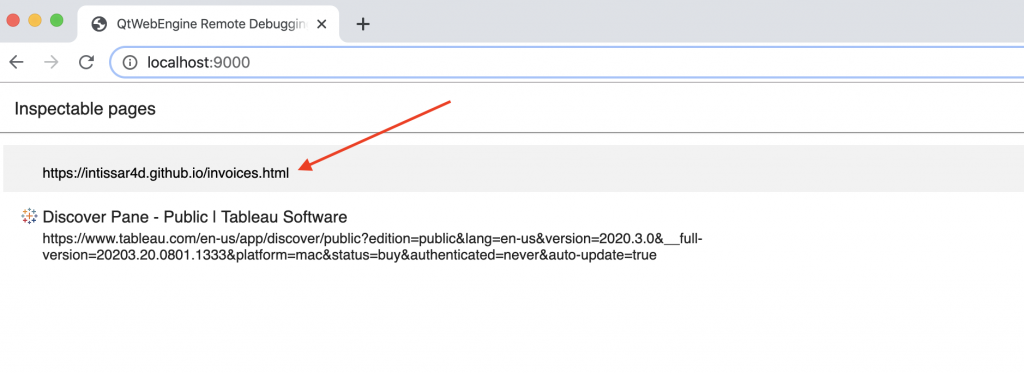
Tableau gives you the ability to use the Chrome browser and the Chrome DevTools to debug your WDC while it’s running in Tableau Public. Here are the steps to follow:
If you’re interested in knowing more about debugging the WDC inside Tableau, check out this page from the official documentation. Happy debugging!
And if you have any questions, please feel free to join the discussion on the 4D forum.
Got a question, suggestion or just want to get in touch with the 4D bloggers? Drop us a line!
* Your privacy is very important to us. Please click here to view our Policy
Comments are not currently available for this post.