4D v18 R6 comes with new features in the code editor to make things easier for you when writing code.
The same goes for the debugger. We know debugging an application can be difficult, that’s why we never stop working to help make your experience better. This time, we’ve added some options and additional information that will make it easier to trace and analyze your code.
Keep reading to see what’s in store for you:
Parameters
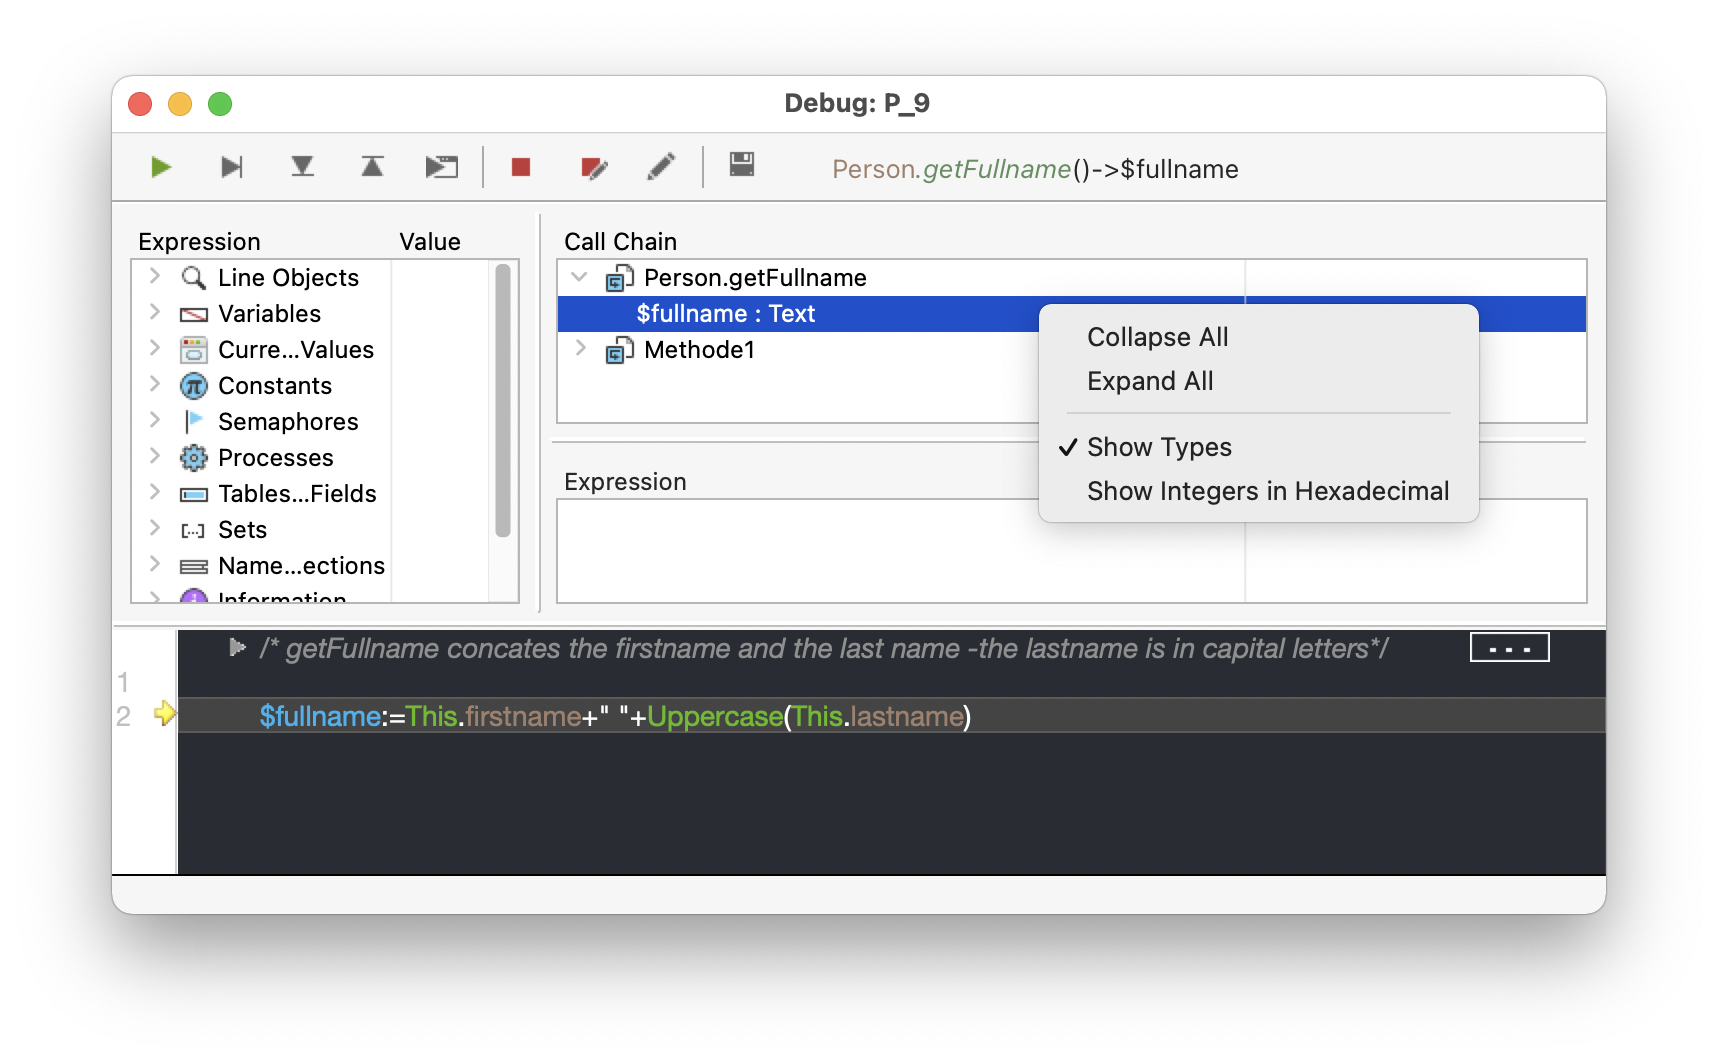
Knowing the input and output parameters of a method or function, as well as their type, is essential for debugging code. The declaration line is displayed at the top-left of the debugger window. In the call chain pane, you can choose to display (or not) the parameter’s type.

Comments
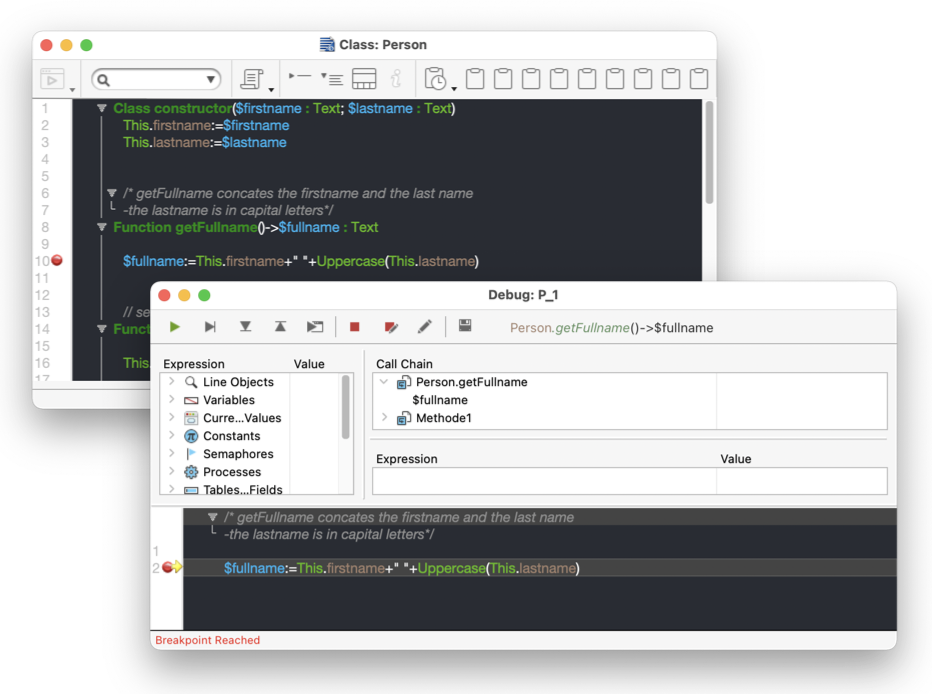
To help explain a method or function, comments are usually included at the beginning of the code. Good news! These comments are now visible in the debugger:

Want to increase your debugging skills even more? Check out this 4D Summit 2020 video: A New Era of Debugging!


Comments are not currently available for this post.