PROCESS 4D TAGS has been enhanced with each 4D version and the latest additions as 4DCODE have drastically increased the use cases. What was previously a single line of code, is now often many lines, even pages, of 4D code.
The debugger has always been useable inside 4DCODE tags, but only in interpreted mode.
PROCESS 4D TAGS is often used for smart, complex templates, but some issues only happen on the customer side with customer data. You could insert your own logs in the code, but what if there was a better way?
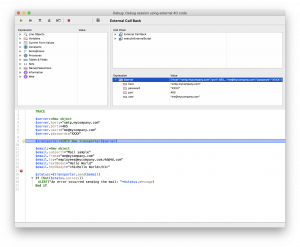
Now you can debug the code using the TRACE command. Even if your application is compiled, because this code is executed in an interpreted context, the debugger will help you analyze what’s happening. All functionalities are available: call chain, watch, and custom watch panes. Even breakpoints are available for the debug session!
EXAMPLE
Let’s take a complex report, produced by a smart template. Depending on the settings, the template produces an HTML or Excel file – or sends the results directly as an email. Now the customer calls, reporting that sending email is failing in their new office. It works for you, something onsite? Sound familiar?
Simply insert TRACE in the 4DCODE block of your template and run the method. The following debugger now appears:
 You’re welcome!


Comments are not currently available for this post.