Since its release, ORDA has grown in popularity and is now widely used on your production servers.
With 4D v20, we provide two improvements on how ORDA requests are logged server-side:
- The first is an improvement of the request log that will now give more information about ORDA calls.
- The second is the addition of a server-side ORDA log similar to the client-side ORDA log. Let me introduce you to these new features.
The first improvement impacts the request log. The request log is critical to optimize your production server. It gives you information about the requests received, the time it took to handle them, and the data sent on the network. It’s also important to consider that activating logs has a performance impact. The request log is remarkably optimized and can be used on production without impacting the server performance too much.
If you activate the request log on your server, you see that ORDA requests are logged with a request id in the 14000s (you can find the request ids here). You also have information about the dataclass or attribute in the extra column.
For example, this line indicates that the attribute Employee.Bloby has been modified (in bold the request id and the content of the extra column):

The second improvement is that it is relatively easy to use. You can activate server-side ORDA logs by calling the function startRequestLog on the datastore. For example:
ds.startRequestLog()
If you execute this code snippet, all your ORDA requests will be logged inside the ORDAlog.JSON file. The server-side ORDA logs use the JSON lines syntax, with each line being a JSON description of the request sent. Here is an example of such a line:
{

    "url": "rest/Company[4]",

    "systemUserName": "nbrachfogel",

    "userName": "Designer",

    "machineName": "OPT9010-1168",

    "taskID": 5,

    "taskName": "P_1",

    "startTime": "2023-05-22T14:29:00.289",

    "response": {

        "status": 200,

        "body": {

            "__entityModel": "Company",

            "__DATACLASS": "Company",

            "__KEY": "4",

            "__TIMESTAMP": "2023-03-30T14:16:47.337Z",

            "__STAMP": 1,

            "ID": 4,

            "Name": "Compagnie 31740",

            "Turnover": 32205,

            "MyEmployees": {

                "__deferred": {

                  "uri": "/rest/Company[4]/MyEmployees?$expand=MyEmployees"

                }

            }

        }

    },

    "sequenceNumber": 60,

    "duration": 282

}
You can see information about the user, the duration it took to execute the request, and the response from the server. You also have the sequence number, which is the same number you’ll find in the request log, linking both logs (if the request log is not activated, the sequence number is omitted in the ORDA log).
The server-side ORDA log is very interesting for troubleshooting. It gives detailed information about the server’s requests and responses. But it takes a lot of CPU and disk space, so you should use caution on your production server.
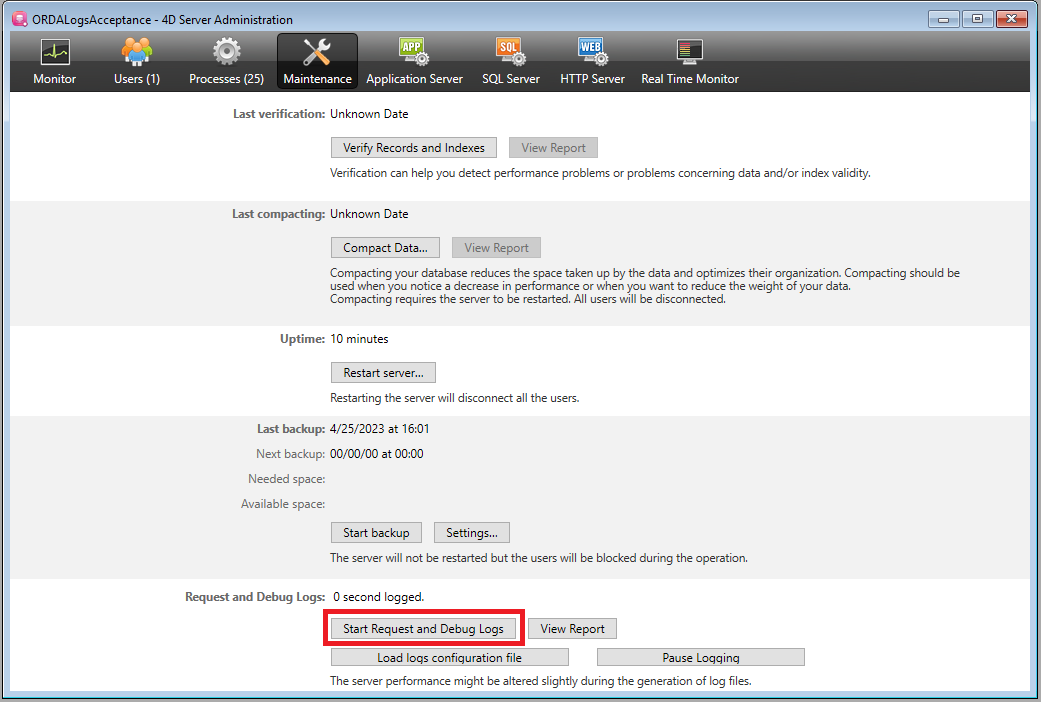
These 2 logs can also be activated with the log configuration file or directly from the maintenance tab of the 4D Server administration window.

The Start Request and Debug Logs button will activate both the request and the ORDA log.
We expect these 2 features will help you troubleshoot and optimize your ORDA calls. If you have comments or questions, please bring them to the 4D forums.
Note: Interested in ORDA but don’t know where to start? Plenty of resources are available to guide you from beginner to expert level. We gather them all in a single post to make it even easier. Read the guide.


Comments are not currently available for this post.