
Access Qodly Studio for 4D directly from your 4D server to test and debug your code
October 30, 2024
2 min read

Qodly Studio for 4D allows you to extend your 4D applications with web pages. Development is integrated into 4D Developer Edition.
During the development phase, there are often times when specific features or bugs can only be replicated on a server or in a production environment. This poses a challenge for developers, who require direct access to debugging tools to efficiently resolve issues.
With the latest release of 4D 20 R7, Qodly Studio for 4D is now accessible directly from your 4D server, you can debug and test your Qodly application like never before.
Here’s a quick guide on how to make the most of this new feature.
To access Qodly Studio, in the “Window” menu on your 4D Server, click on the “Qodly Studio” menu item, which becomes active when your project is opened in interpreted mode.
In addition to launching Qodly Studio, you’ll notice the new “Preview Qodly Application” option. This feature allows you to open a live preview of your website designed with Qodly, enabling you to visualize changes in real-time.

Now that you’ve opened the Studio you can attach the debugger to Qodly.
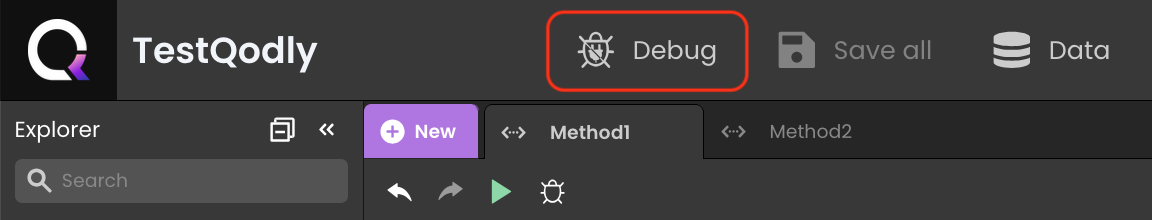
Please note that only one debugger can be attached to a project at any given time. So, if you have a debugger attached to a client or the 4D server, an error will occur. Be sure to manage your debugging sessions accordingly!
Voilà! You’re ready to test and hunt for bugs.
For further insights into Qodly Studio for 4D, we invite you to explore our series of informative blog posts. Don’t forget to share your thoughts and experiences on our forum.
Got a question, suggestion or just want to get in touch with the 4D bloggers? Drop us a line!
* Your privacy is very important to us. Please click here to view our Policy
Comments are not currently available for this post.