
A Better Admin Window for 4D Server: Much More Informations about Sessions

July 14, 2026
6 min read
Administering a 4D Server often means monitoring several connection types at the same time: desktop clients, Web sessions, REST access, and SOAP calls. Until now, this information could be scattered or difficult to compare quickly.
With this new evolution of the administration window, the Sessions tab becomes much clearer, more consistent, and above all more practical on a daily basis. The goal is simple: provide a unified view of all active sessions while displaying contextual details adapted to the selected session type.
In a real production server, the issue is not so much a lack of information as the way information is spread out. When a slowdown appears or abnormal behavior is detected, you often need to understand quickly what is going on. But with client sessions, REST calls, and Web or SOAP connections, analysis can quickly become fragmented.
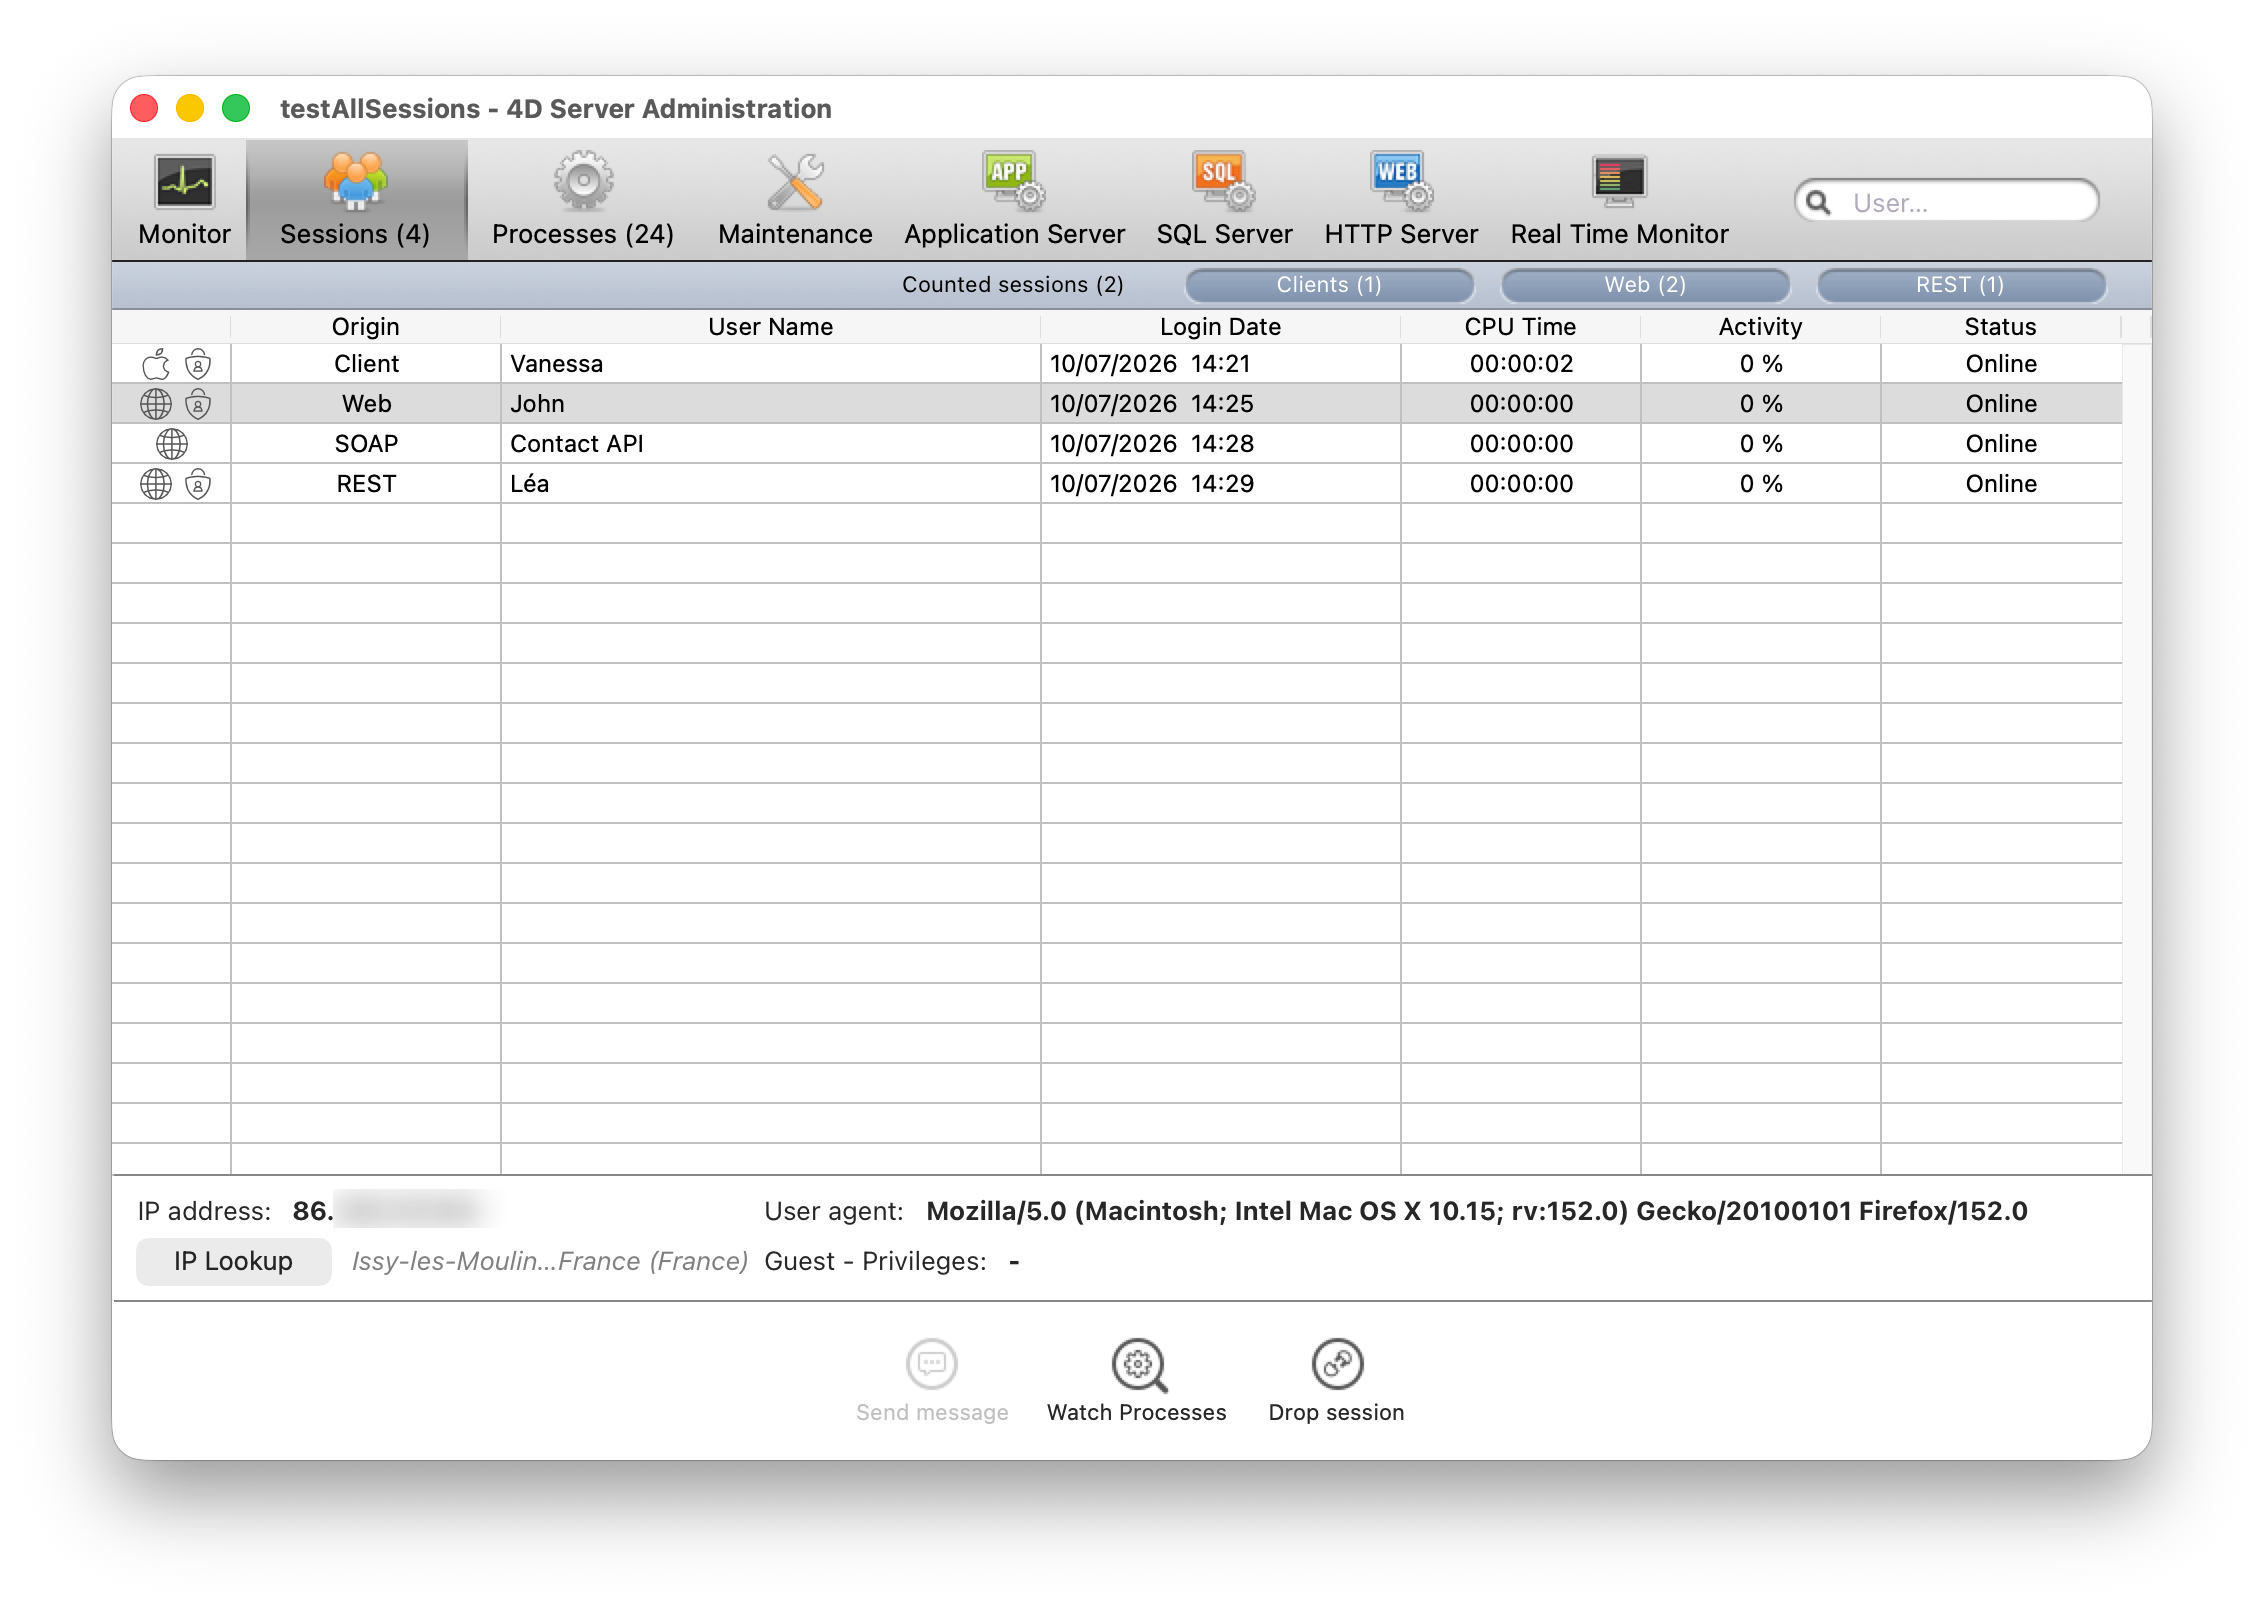
The first visible change is the simplification of the session list. From now on, all connections are displayed in a single view, regardless of type. Desktop client, REST, Web, and SOAP sessions all appear in the same list, providing an immediate global view of server activity.
This list only shows information that is truly common to all sessions. You can find the session type, user name, connection date, CPU time, activity, and session state. The idea is to avoid overloading the interface with type-specific fields that make line-by-line comparison harder.
An important element of this new view is the first column, fully dedicated to icons. It lets you visually identify the session type without even reading text. An Apple icon represents a macOS client, a Windows icon represents a Windows client, and a globe icon groups Web, REST, and SOAP connections. An additional visual distinction also indicates whether the session is authenticated.
With this approach, you can identify the distribution of active connections at a glance without diving into details.
The second major change concerns the details panel located at the bottom of the window. This is where the real value of this evolution appears.
When you select a session, the panel automatically adapts to its type. For a Client session, for example, you can find the operating system session name, IP address, machine name, as well as indicators related to 4D Write Pro and 4D View Pro usage rights. These elements immediately show the context in which the user is working and which features they can use.
For REST, Web, or SOAP sessions, the content is different but just as diagnosis-oriented. It displays, in particular, Guest status, the list of privileges associated with the session, the IP address, and the User Agent. This helps quickly identify the nature of the call and the type of client being used.
One of the most useful elements in this panel is the IP lookup button. In one click, you can launch geolocation for the displayed address. The result appears directly below the IP address, in a simple format such as “City – Region (Country)”. If no information is available, especially for a private address, the IP lookup button is not displayed. This avoids ambiguity and keeps interpretation clear.
License management is one of the key responsibilities when administering a 4D server in production. Yet it is not always easy to quickly understand which connections are actually using resources and how that usage changes over time.
With the new Admin window, this analysis becomes much more immediate. Since all sessions are now grouped in a single view, you can monitor global server activity in real time and easily identify which connection types are active: desktop clients, Web sessions, REST calls, or SOAP connections.
This centralization gives, first and foremost, a much clearer reading of actual server usage. In just a few seconds, you can see whether most connections come from standard client workstations, whether some Web applications generate multiple sessions for the same user, or whether REST calls consume more resources than expected.
This kind of situation appears, for example, when an application does not correctly use session cookies. Instead of reusing an existing session, each request may create a new server-side connection. The result: several similar sessions appear in the Admin window with the same IP address, the same User Agent, or the same privileges. This behavior becomes immediately visible and makes configuration or implementation issues much easier to detect.
Beyond basic diagnosis, this visibility also helps anticipate needs more effectively. By observing peak periods and connection habits, it becomes easier to assess whether the number of available licenses actually matches everyday server usage.
This unified view also helps spot behavior that previously went unnoticed more easily. For example, automated sessions that remain active for too long, very frequent REST connections, or users connected simultaneously from multiple workstations.
The objective is not only to count connections, but above all to understand how server resources are truly used in order to optimize day-to-day administration.
Let us take a very simple case. The server starts slowing down and you notice unusual activity. You open the Sessions tab and see a REST session consuming more resources than the others.
You click it. Immediately, the details panel shows its IP address, User Agent, and associated privileges. By launching an IP lookup, you get a location that gives you a first clue about where the request comes from.
In just a few seconds, you already have a clear picture of the situation. You know where the session comes from, which client type is being used, and in what context it operates. You only need to contact the owner or check the relevant API. What could have required several tools or multiple log levels is resolved here directly from a single interface.
This new Admin window for 4D Server does not just reorganize existing information. It truly changes how sessions are analyzed by centralizing visibility, simplifying comparisons, and providing immediately actionable context.
By grouping all sessions in one unified view and dynamically adapting the details displayed, it helps you understand what is happening on the server faster and respond with much greater reactivity.
In the end, this evolution does not just change the interface, but above all the way a production system is diagnosed and administered.
Got a question, suggestion or just want to get in touch with the 4D bloggers? Drop us a line!
* Your privacy is very important to us. Please click here to view our Policy
Comments are not currently available for this post.